Financial Indicators
(TL million) |
2020 |
2021 |
Change (%) |
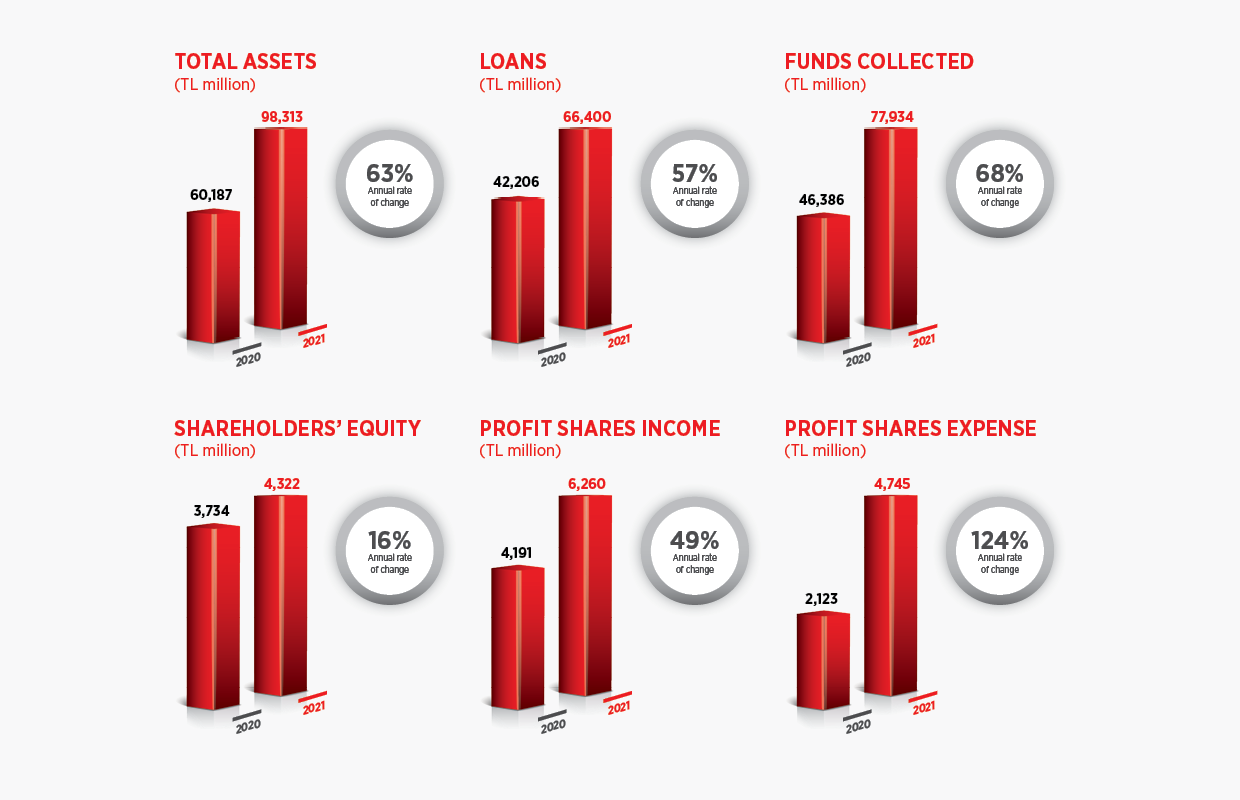
Total Assets |
60,187 |
98,313 |
63 |
Liquid Assets and Banks |
10,274 |
18,639 |
81 |
Securities Portfolio |
6,896 |
11,702 |
70 |
Loans* |
42,206 |
66,400 |
57 |
Funds Collected |
46,386 |
77,934 |
68 |
Shareholders’ Equity |
3,734 |
4,322 |
16 |
Profit Shares Income |
4,191 |
6,260 |
49 |
Profit Shares Expense |
2,123 |
4,745 |
124 |
Profit Before Tax |
792 |
730 |
(8) |
Net Profit/Loss |
639 |
559 |
(13) |
*Expected Loss Provisions and Non-Performing Receivables are included.