- INTRODUCTION
- Our Mission, Our Vision and Our Strategies
- Corporate Profile
- 2016 Highlights
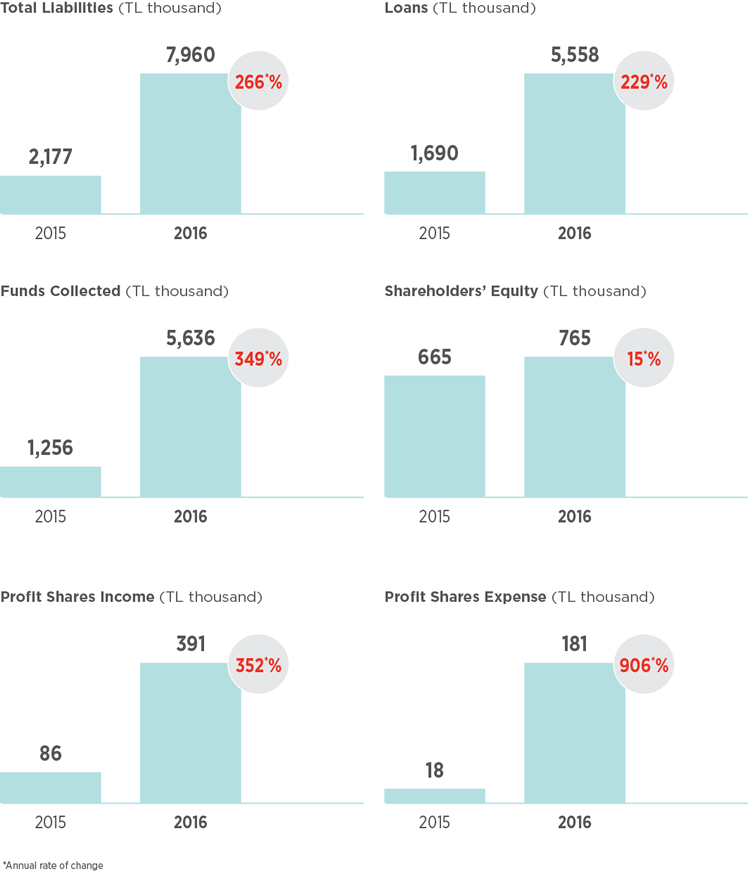
- Key Financial Indicators
- The Shareholding Structure
- Milestones in the History of Ziraat Participation
- Chairman’s Assessment
- CEO’s Assessment
- Highlights in 2016
- Macroeconomic Outlook
- An Assessment of 2016: Strategies, Developments and Future Goals
- Changes in the Articles of Association in 2016
- The Report on Compliance of Annual Report
- MANAGEMENT AND CORPORATE GOVERNANCE PRACTICES
- Ziraat Participation Board of Directors
- Ziraat Participation Senior Management
- Summary Report by the Board of Directors
- Information on the Activities of the Committees
- Human Resources Practices and Policies and the Expectations Regarding 2017
- Transactions Carried out with Ziraat Participation’s Risk Group
- Companies from which Support Services Are Obtained
- FINANCIAL INFORMATION
AND RISK MANAGEMENT- Audit Committee’s Assessments of the Operation of the Internal Audit, Internal Control and Compliance, and Risk Management Systems
- Ziraat Participation’s Financial Standing, Profitability and Solvency
- Ratios
- Information about Risk Management Policies and Activities According to Type of Risk
- Summary Balance Sheet and Income Statement
- Unconsolidated Financial Statements and Notes Together with Independent Auditors’ Report at 31 December 2016
- Consolidated Financial Statements and Notes Together with Independent Auditors’ Report at 31 December 2016
- CONTACT INFORMATION
2016 Annual Report